Updated: | Originally published: | By Hayley Brown
Dashboard applications are useful tools that provide information quickly and easily. They can be tailored to a wide range of use cases from tracking time spent on a project, business objectives or customer health.
What are dashboard applications?
Dashboard applications are information management tools that present and organise data. The business information is formatted in a single, easy-to-read view with visuals to simplify data inputs and reports.
Dashboard applications allow users to track progress easily against objectives and key performance indicators (KPIs). It does this by pulling data from other integrated applications into a single database.
The dashboard then displays the information visually and in real-time.
Popular Dashboard Connectors for Integrations


Typical Dashboard Integrations
Dashboard integrations can be used across organisations as useful insights for managers and teams to see real-time data in one place at a quick glance.
Dashboard and Developer Tool Integrations
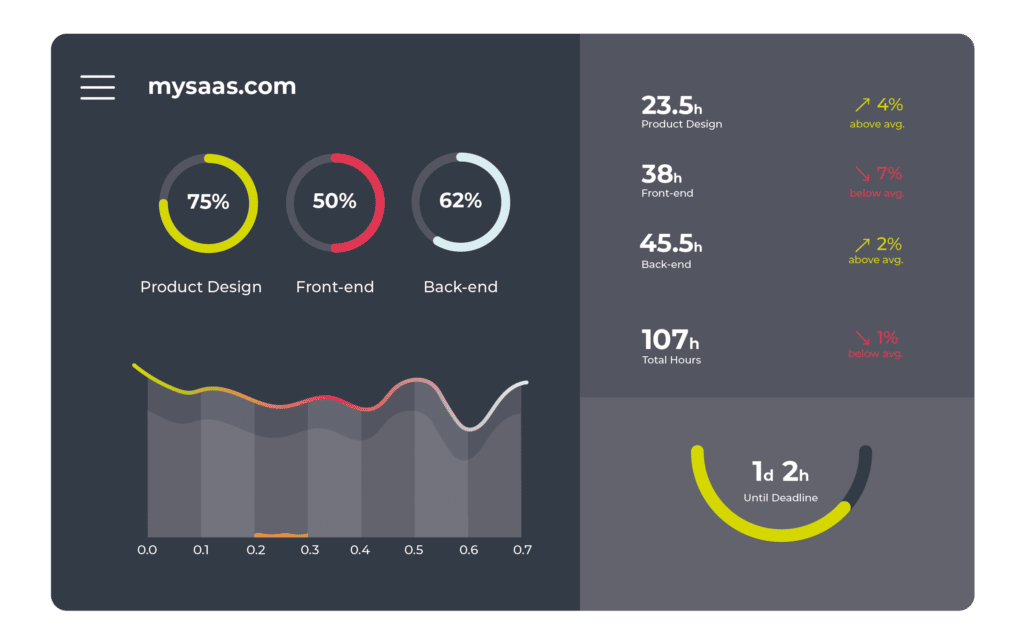
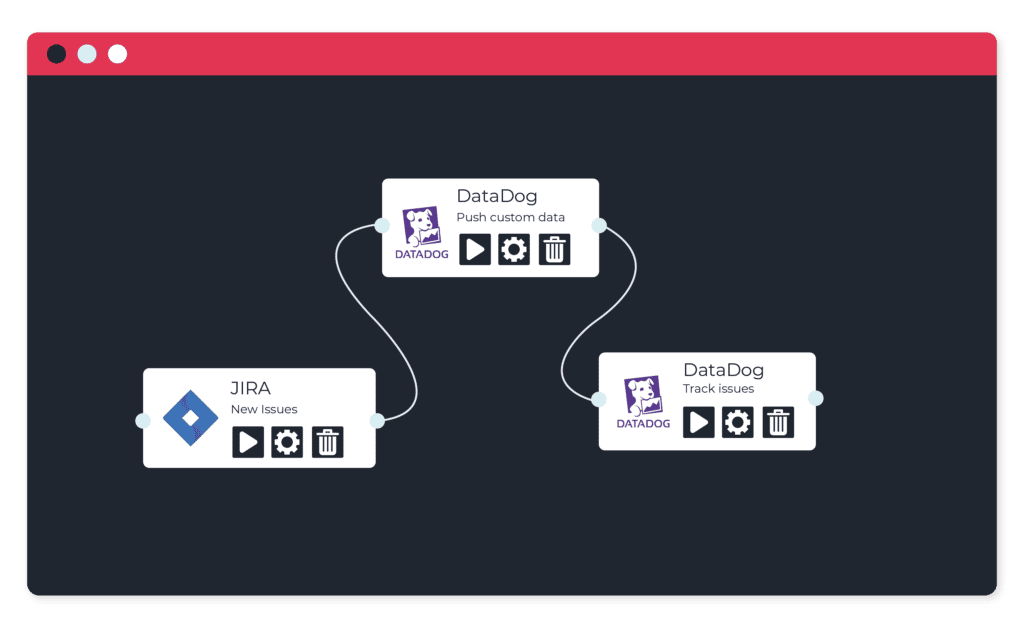
One way in which a dashboard can be implemented is alongside your developer tool(s). By integrating the applications you’ll be able to see the time spent on a project, when the deadline is and when or what time is most productive. This data can then show averages based on previous data.
This type of integration is especially useful in regard to project management.
Other dashboard and developer tool integration examples:
- Combine external data sources and tools with your application’s development environment to enhance your data
- Add additional data and tools to your application using low code tools
- Trigger a new project management board when a new goal has been added to the dashboard
Dashboard and Analytic Integrations
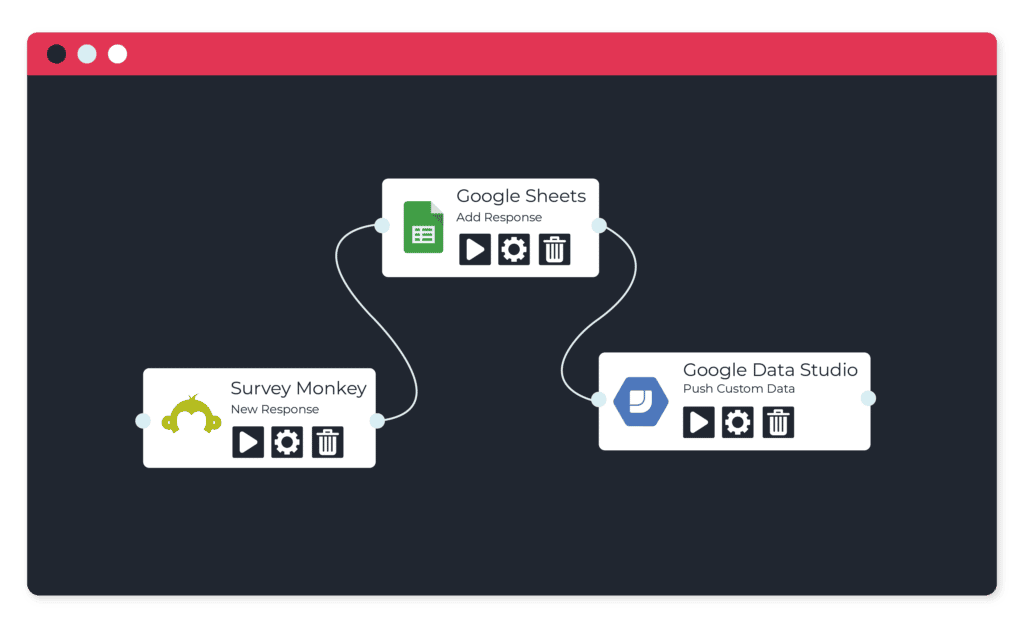
Creating an integration between your analytic software and a dashboard is a great way of understanding customer experience. For instance, when new feedback has been received the data can be easily input into the corresponding fields. These fields could indicate customer satisfaction, engagement and so on.
Other dashboard and analytic integration examples:
- Run a data tool report when a new survey response is created in analytics
- When new incoming feedback has been received from analytics create a measurement in the dashboard
Dashboard and Data Tool Integrations
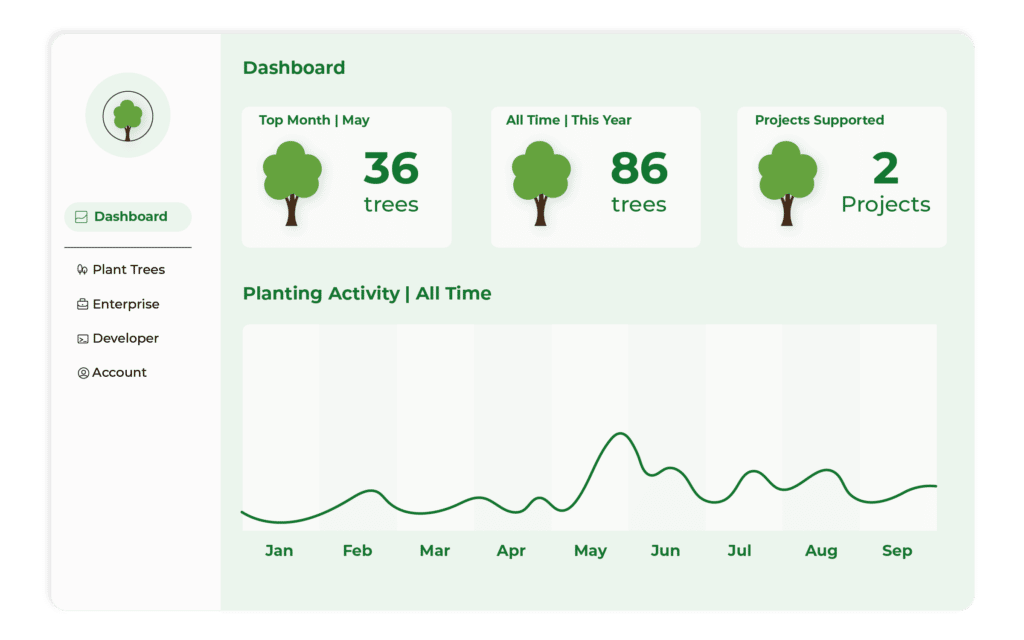
Probably the most obvious dashboard integration is with data tools and databases. When the tools have been updated or added to they can then automatically update the dashboard in real-time. For instance, when a new sale has been completed the information can be passed from CRM to the database and displayed with other sales from the month/all time within a dashboard.

Other dashboard and data tool integration examples:
- When a new goal has been added to the dashboard trigger a new metric post to the data tools
- Update dashboard from new rows in the data tool
Dashboard and Marketing Integrations
A dashboard and marketing integration can help the team understand their efforts from one visual place. For instance, visualising the marketing budget and where it is being spent. As well as how ads are performing.
A marketing and dashboard integration could also track the health of customers/subscribers. This would include their engagement levels, or perhaps progress within the sales funnel.
Other dashboard and marketing integration examples:
- Export new or updated marketing contacts to spreadsheet and update dashboard
- Push custom data to the dashboard when a new marketing campaign link clicked
- Update dashboard from new rows in database with new subscribers to track engagement
How are these types of integrations beneficial to an organisation?
These types of dashboard integrations are beneficial to an organisation because they provide a single view of data. As a result, teams can see the progress of a project or the number of sales for a quarter.
Dashboards are highly customisable to suit many different use cases, this makes them a useful and beneficial tool in your organisation.